Compare imputation accuracies of different imputation methods (Beagle 5.1, LinkImputeR, kNNi, FILLIN) by calculating the percentage of correctly imputed genotypes in TASSEL GUI software. Please find more information on TASSEL software and its documentaton at this Link
In this tutorial, I am only showing how one can evaluate the imputation accuracy in TASSEL GUI using LinkImpute (LD kNNi) imputation algorithm. In my research experince, I have worked with genotype data of maize, teosinte, soybean, and grapes, and LinkImpute has been an efficient imputation algorithm with low imputation error rate.
Note: I strongly suggest to try other imputation methods and compare their error rates, which can be easily done in TASSEL GUI software by following the below steps:
Importyour genotype data (VCF, Hapmap and other formats)Maskabout 1-10% of the genotype data usingMask Genotypeplugin underDataImputethe masked genotype data (I use LD kNNi or linkimpute) or load imputed data using different platform such as Beagle, but make sure that imputation was performed on the SAME masked genotype dataSelectthe three files (Raw data, Masked data, and Imputed), and clickEvaluate Imputation AccuracyunderImputeand press OK- Summary of the evaluation should be generated in the new node
Steps in TASSEL GUI
The above steps are also shown in the below steps:

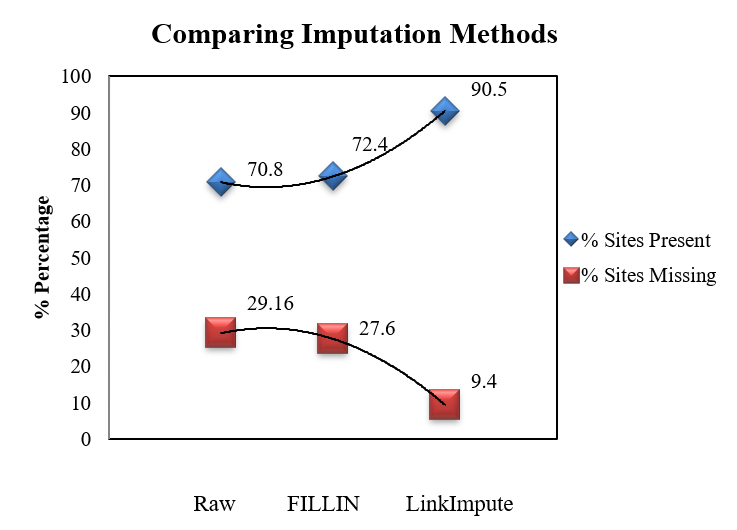
Plot imputation accuracies
One can plot the imputation accuracies by exporting the evaluation summary stats in R or Excel as shown in example below:

Thank you for reading this tutorial. I really hope these steps will assist in your analysis. If you have any questions or comments, please comment below or send an email.
Bibliography
Glaubitz, J. C., Casstevens, T. M., Lu, F., Harriman, J., Elshire, R. J., Sun, Q., & Buckler, E. S. (2014). TASSEL-GBS: a high capacity genotyping by sequencing analysis pipeline. PloS one, 9(2), e90346.
Money, Daniel, et al. “LinkImpute: fast and accurate genotype imputation for nonmodel organisms.” G3: Genes, Genomes, Genetics 5.11 (2015): 2383-2390.