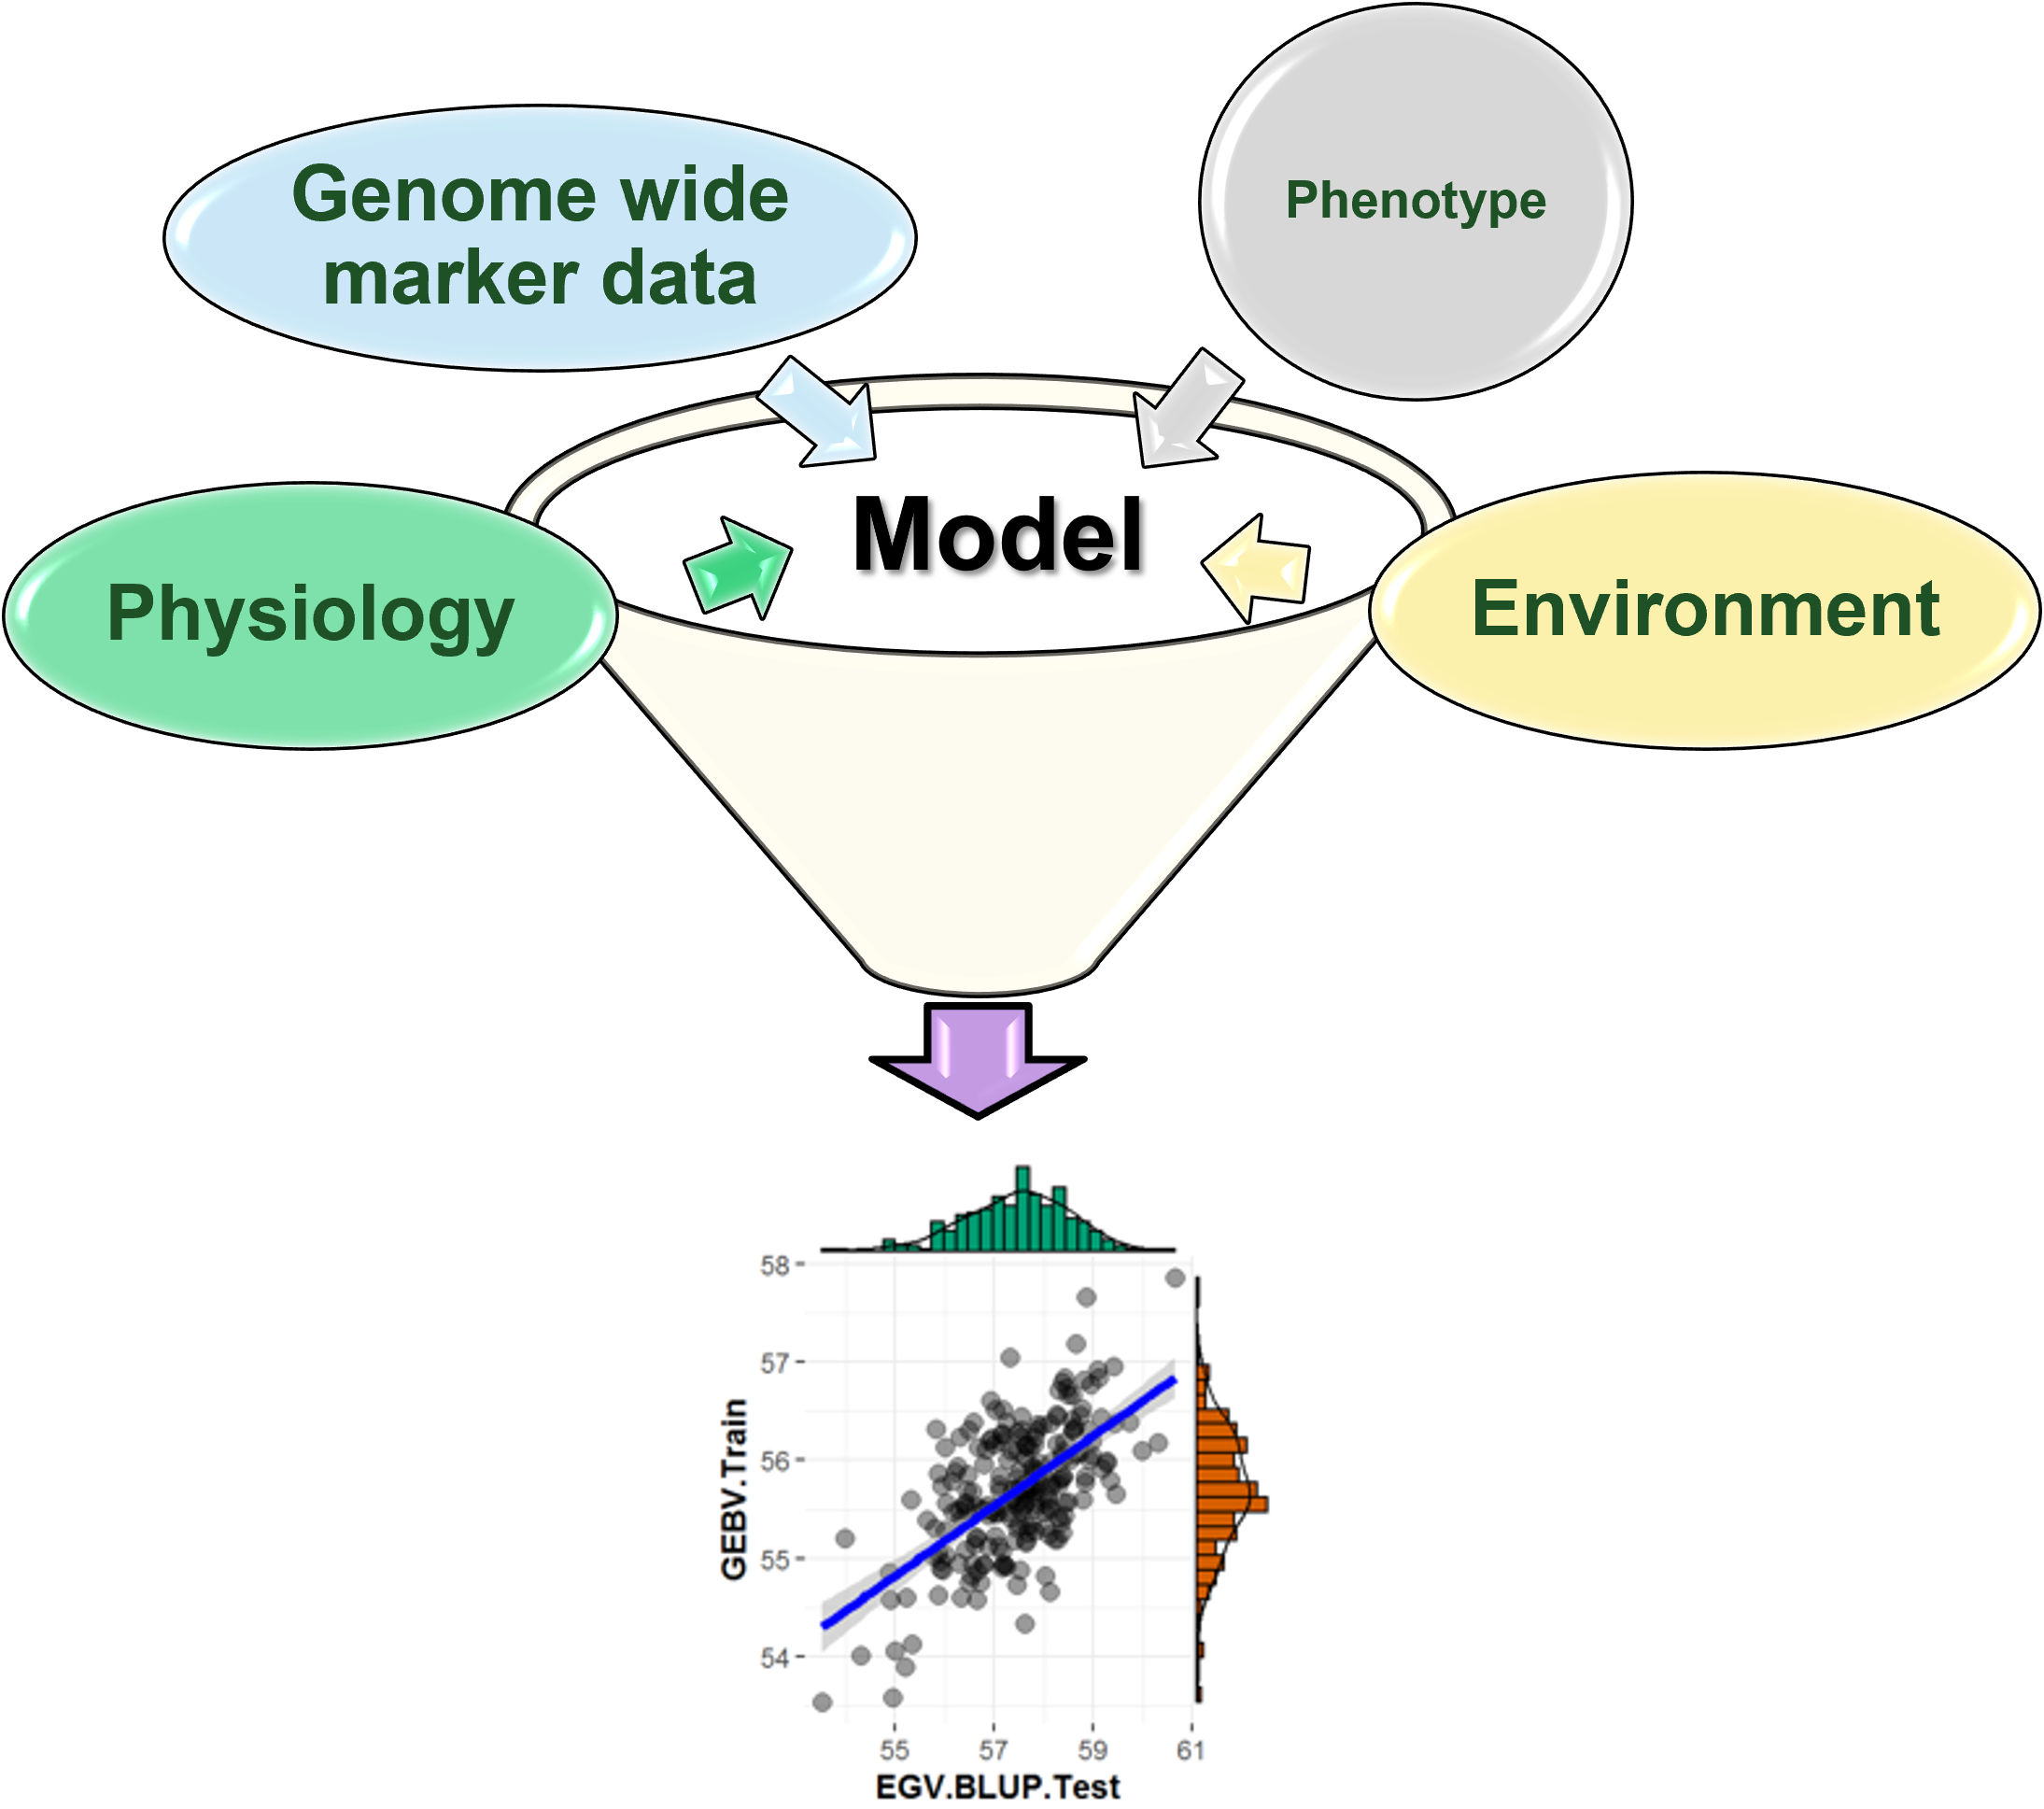
Ideally alleles or haplotype of a single or multiple markers identified post-GWAS or QTL analysis are used to evaluate their effect on a trait of interest. The goal of this tutorial is to visualize the allele effects of a genetic marker on a trait (phenotype) utilizing a R package ggstatsplot...
[Read More]
Haplotype extraction and LD visualization in Haploview
Haploview software is a Java based open source software, developed by Broad institute at MIT for haplotype analysis and LD visualization. I recommend reading more about it at this Link for in-depth information. As per the documentatioin of this software, one can perform wide range of analyses such as LD...
[Read More]
Evaluate Genotype Imputation Accuracy in TASSEL GUI
Compare imputation accuracies of different imputation methods (Beagle 5.1, LinkImputeR, kNNi, FILLIN) by calculating the percentage of correctly imputed genotypes in TASSEL GUI software. Please find more information on TASSEL software and its documentaton at this Link
[Read More]
Machine Learning algorithms for Genomic Selection of Quantitative Traits with varying Heritabilities
Multiple Quantitative traits were evaluated with varying heritabilties to study how the inheritance of a trait affect the performance of genomic selection and prediction models. Machine learning algorithms Random Forest and GLMnet: Lasso and Elastic-Net Regularized Generalized Linear Models were deployed to develop Genomic selection models using the publicly available...
[Read More]
RNA-Seq data analysis in R - Investigate differentially expressed genes in your data!
In this tutorial, negative binomial was used to perform differential gene expression analyis in R using DESeq2, pheatmap and tidyverse packages. The workflow for the RNA-Seq data is: Obatin the FASTQ sequencing files from the sequencing facilty Assess the quality of the sequencing reads Perform genome alignment to identify the...
[Read More]
Utilizing Machine Learning algorithms (GLMnet and Random Forest models) for Genomic Prediction of a Quantitative trait
In this tutorial, I used two popular machine learning algorithms: Random Forest and GLMnet for Genomic Prediction of a quantitative trait. There are several machine learning R packages available, however, in this tutorial i used caret package. The objective was to develop two models: Random forest and glmnet using real...
[Read More]
Correlation analysis using R Shiny Application
R Shiny statistical output visualization app, where a user can upload their own numeric data in .csv or .txt formats, and generate a correlation matrix plots that also contains density plots and printed coefficient of correlation values. Please check it out by uploading your own data below.
[Read More]
Import SSR marker data in TASSEL software
In this tutorial, I would like to share how one can import SSR (simple sequence repeats) marker data on to TASSEL software, and perfrom analyses such as imputation, General Linear Model and Principle Component Analysis.
[Read More]
Check for mendelian errors using pedigree and genotype information
Cluster based methods such as multidimensional scaling (MDS) and priniciple component analysis (PCA) are traditionally used in identifying samples with genotypic inconsistencies, however, it is important to identify genotypes with high mendelian inconsistencies prior to any genetic or statistical analysis. In this tutorial, I would like to share how one...
[Read More]
Pruning genetic markers based on their physical distance and linkage disequilibrium (LD)
High density markers do not provide any additional information, therefore, can be pruned based on the physical distances between adjacent markers and linkage disequilibrium (LD). In this tutorial, I will show how to prune markers based on their physical position in TASSEL software, and based on LD in PLINK software....
[Read More]
Genome-wide Association Study (GWAS) in TASSEL (GUI)
TASSEL aslo known as Trait Analysis by aSSociation, Evolution and Linkage is a powerful statistical software to conduct association mapping such as General Linear Model (GLM) and Mixed Linear Model (MLM). The GUI (graphical user interface) version of TASSEL is very well built for anyone who does not have a...
[Read More]
ANOVA and Tukey test in R software in just few steps!
ANOVA also known as Analysis of Variance is a powerful statistical method to test a hypothesis involving more than two groups (also known as treatments). However, ANOVA is limited in providing a detailed insights between different treatments or groups, and this is where, Tukey (T) test also known as T-test...
[Read More]
Marker Assisted Selection using AmpSeq data
This tutorial video is my attempt to introduce the basics of the AmpSeq data analyis in Marker Assisted Selection .
For general information on technology behind AmpSeq please read one of my previous blog post on it at this link: https://avikarn.com/2019-04-21-AmpSeq/
[Read More]
Plot Genetic Maps in few steps using MapChart software
MapChart is a free software to plot publishing quality genetic maps as well as QTL data. This software was developed by Roeland E. Voorrips at Wageningen University and can be downloaded at this link .
[Read More]
Investigate genetic admixture using STRUCTURE software
Structure Software is a freely available software package that one may use for rigorous investigation of admixed individuals; identification of point of hybridization and migrants; and estimate over all structure of a population using a commonly used genetic markers such as SNPs and SSRs. This software was developed by Pritchard...
[Read More]
How to use Multidimensional Scaling (MDS) to quality control your genetic data?
Multidimensional Scaling (MDS) is a powerful statistical method that can be effectively used to elucidate hidden population structure, and more importantly, use it as a quality control tool while working on genetic data.
[Read More]
QTL mapping using Composite Interval Mapping (CIM) method in R software
In the Quantitative Trait Locus (QTL) analysis, composite interval mapping (CIM) method estimates the QTL positon with higher accuracy and statistical significance by combining interval mapping with multiple regression. This method also controls background noise resulting from genetic variations in other regions of the genome that affect the detection of...
[Read More]
Amplicon Sequencing (AmpSeq): Concept and data analysis
Amplicon Sequencing (AmpSeq) technology combines highly multiplexed PCR sequences of multiple barcoded samples in a single reaction. Amplicons include SNP, haplotypes, SSRs and presence/absence variants. Currently, in a single reaction about 400 amplicons and 3000 samples can be processed simultaneously. In this blog, my goal is to basically introduce the...
[Read More]
Call GBS SNPs in 7 steps using TASSEL GBSv2 pipeline
Genotype-by-Sequencing (GBS) is reduced representation of a genome, which utilizes restriction enzymes (e.g. ApeKI) and NextGen sequencing to identify biallelic markers and presence/absence markers. In this post, my attempt is to consisely present the GBS SNP calling process in 7 steps using the TASSEL GBSv2 pipeline. Pleae note:, Buckler et...
[Read More]
Genetic map construction in LepMap3
Building genetic maps can be challenging and sometimes quite stressful, especially, when dealing with thousands or even millions of markers. In this post, I am hoping to help anyone who would like to get started to build a decent genetic map in an open software Lep-MAP3 , and finally, evaluating...
[Read More]